Look at the screen of a retail trader. You will see six, ten, or twelve different charts open at the same time. The trader is looking from one screen to another, trying to figure out if the...
The retail trading world is obsessed with time. You look at one-minute charts, five-minute charts, and hourly charts, trying to find a pattern. This obsession is a trap. Time is a constant that...
Retail traders are obsessed with the flat, one-dimensional views provided by the industry. You open a time/price chart, draw a horizontal line, and call it support. You are looking at a single...
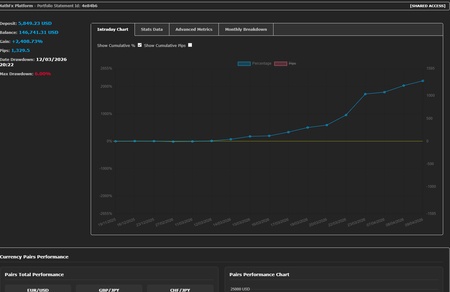
What follows is not a backtest. It is not a hypothetical equity curve drawn to illustrate a concept. It is the complete balance history of a live trading...
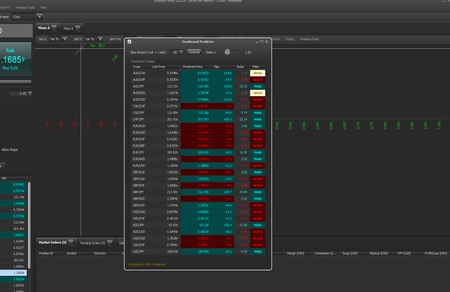
Every indicator in conventional technical analysis works the same way: it observes price history on a single currency pair and extracts a signal...
Retail traders operate under the illusion that any currency pair can move to any price level at any time. This assumption is mathematically false. The exchange rates of the 28 major pairs are...
The traditional trader's gaze is fragmented. You open ten different windows, look at ten different charts, and try to guess their interdependence. This cognitive division is a waste of energy. It...
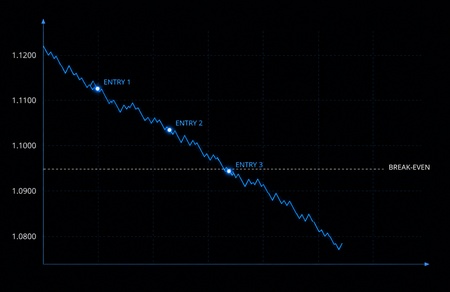
When a trade moves against you, the immediate retail reflex is to panic and close the position at a loss. I don't panic. I calculate. You can exit a losing position at break-even if you understand...
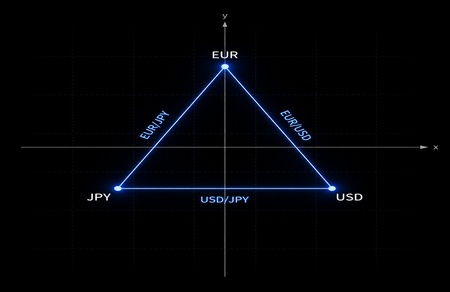
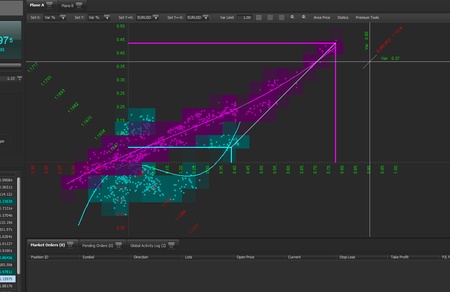
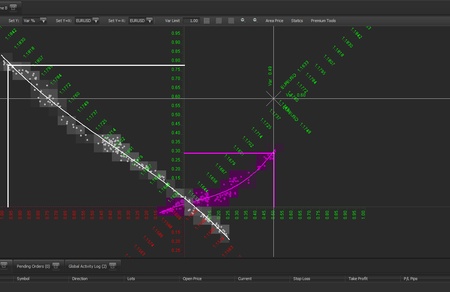
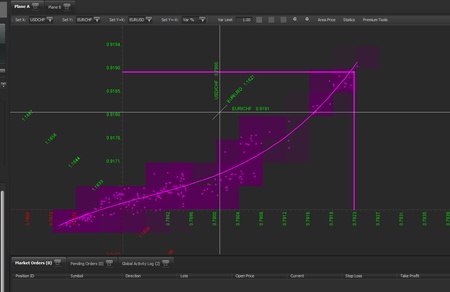
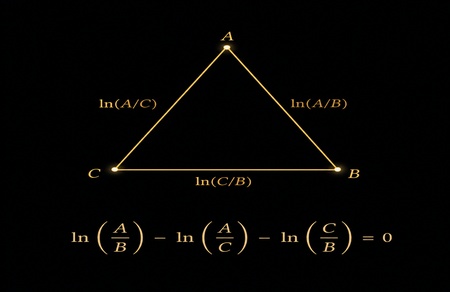
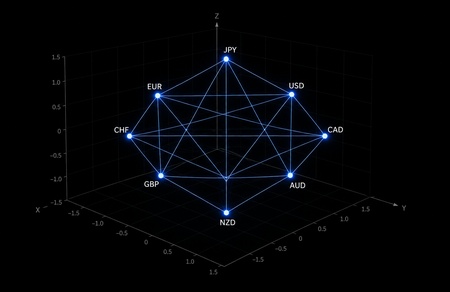
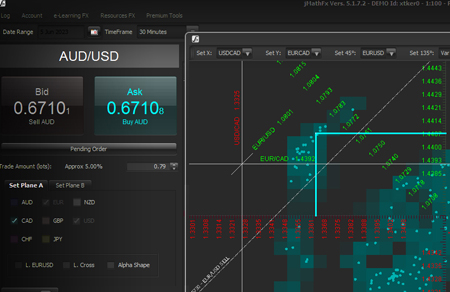
Traditional retail charts hide the real market structure. When you look at three related currencies like EUR, USD, and JPY, they form a geometric triad. I analyze this as a triangle on the...
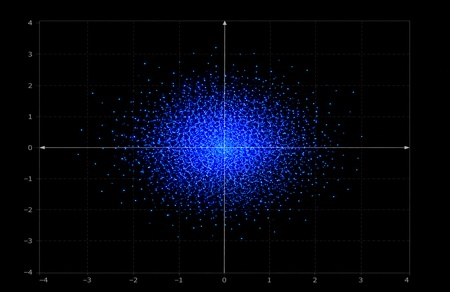
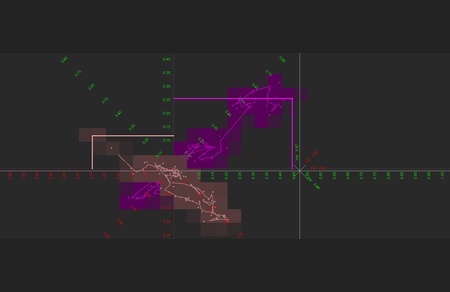
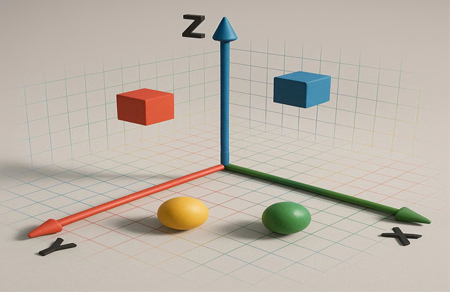
Look at a standard time/price chart. It represents the future as a complete void. It tells you absolutely nothing about where price is allowed to exist. On a coordinate plane, however, the space...
When you project currency values onto a multi-dimensional coordinate plane, you must ensure that your spatial measurements remain consistent. A single coordinate system can experience distortions...

Look at a standard price chart. It is just a single line moving from left to right. This linear representation is forced by the inclusion of time as the independent variable. It is a flat,...
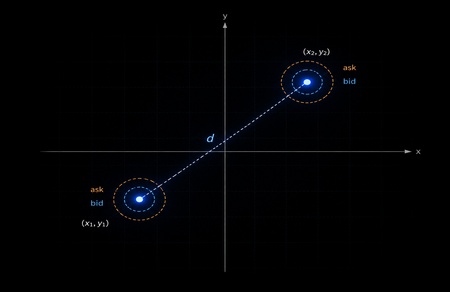
Forget the retail broker stories about spreads being simple commissions. In the interbank market, the spread is a dynamic reflection of liquidity and structural equilibrium. When you throw away...
The retail trading industry wants you to treat currency pairs as isolated financial assets. You open your charts, draw some subjective lines, and make a bet. Then you open another pair and do the...
Every charting platform in existence shows you the same thing: a currency pair, plotted against time. The horizontal axis is always time; the vertical axis is always price. This is so universal...
There is a persistent myth in the financial markets: that successful trading is a matter of intuition, discipline, or the ability to read visual patterns on a chart. I spent years inside that myth...
Every analytical tool in retail trading asks the trader to make a choice before the analysis begins. Which pair. Which timeframe. Which indicator. Each choice narrows the field of...
When a trader opens a EUR/USD time/price chart, they are implicitly treating the Euro as a one-dimensional object. Something that moves up or down against the Dollar. This is the...
A time/price chart has two axes. Time runs horizontally. Price runs vertically. Every piece of information the chart contains is a function of these two dimensions. This is the...

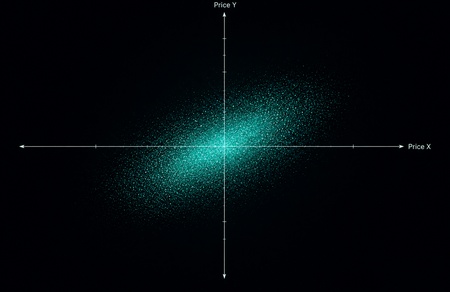
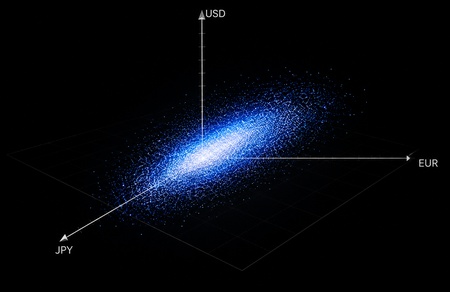
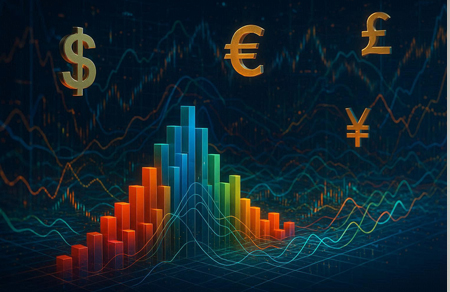
The traditional approach to Forex trading often relies on two-dimensional charts, visualizing price against time for individual currency pairs. While this provides a basic understanding of...

Conventional Forex chart limit your perspective by focusing on individual currency pairs in a 2D format. But the jMathFx Platform takes a radically different approach, employing a...

We understand the hesitation many traders may feel when considering a shift from the familiar candlestick chart to the jMathFx approach. The candlestick chart has been the standard for so...

If you're serious about mastering the forex market, it's time to ditch the traditional candlestick charts and embrace the power of jMathFx. While candlestick charts may seem...

In jMathFx, the concept of stop loss is outdated.
Although it was created with good intentions, over the years it has transformed into a tool of financial torture. It has...

The journey of a novice trader in the world of Forex is often fraught with pitfalls and traps....
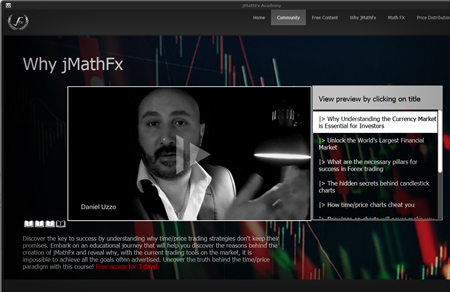
What is jMathFx Academy: Your Best Choice to Improve Your Forex Knowledge
The jMathFx Academy is much more than a learning platform; it's your ideal...
What is jMathFx: A Comprehensive Guide
Contrary to common belief, jMathFx is not a bank, brokerage company, or trust institution. It is crucial...


